Defra's first SFI 2026 statistics are out. We joined them to the SFI26 payment rates to work out where the money actually went, what a typical agreement looks like, and how much of the pot is left for 22 September.
£29,200
Average agreement value
over 3 years (£9,700 a year)
3,100
Live SFI26 agreements
from 7,000 applications
~£30m
Contracted so far, per year
Defra: 75%+ of £60m pre-allocated
38,300
Farm businesses in SFI
up from 32,600 in April 2025
The Rural Payments Agency's records at 1 September give us three things: how many agreements exist across all three SFI schemes, who applied to Window 1, and what they put in their agreements. Defra publishes counts and areas but not money. We have joined the published areas to the SFI26 payment rates in our subsidy library to estimate the value, and the result lands within 1% of Defra's own average agreement value, so we are confident in the totals.
48,000 live agreements, and a quarter of them expire in the next year
SFI now covers 38,300 farm businesses, up 5,700 since Defra's April 2025 count. That is roughly one in three of England's 102,300 holdings, still well short of the 70% coverage Defra has targeted for the end of the transition in 2027. SFI 2023 agreements are three-year deals, so the 25,000 still live start ending this autumn. That is the population Window 2's early-application rule was built for.
- Agreements
- Businesses
Total businesses (38,300) is lower than the sum of the three schemes because some businesses hold agreements in more than one.
View data table
| Scheme | Agreements | Businesses |
|---|---|---|
| SFI 2023 | 25,000 | 23,400 |
| SFI 2024 (Expanded Offer) | 19,900 | 17,900 |
| SFI 2026 Window 1 | 3,100 | 3,100 |
Window 1 reached the farms it was aimed at. Fewer than half are live yet.
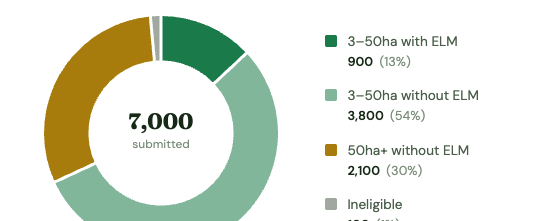
Window 1 was ring-fenced for two groups: farms of 3 to 50 hectares, and farms of any size with no existing ELM revenue agreement. Of the 6,900 eligible applications, 87% came from farms with no ELM agreement and 55% were small farms new to ELM. Only 900 applicants (13%) were existing ELM participants topping up. Just 100 applications were ineligible, which for a first-come-first-served window is a low error rate.
-
3–50 ha, no ELM agreement
3,800 (55%)
-
Over 50 ha, no ELM agreement
2,100 (30%)
-
3–50 ha, existing ELM agreement
900 (13%)
A further 100 applications were ineligible.
View data table
| Group | Applications | Share |
|---|---|---|
| 3–50 ha, no ELM agreement | 3,800 | 55% |
| Over 50 ha, no ELM agreement | 2,100 | 30% |
| 3–50 ha, existing ELM agreement | 900 | 13% |
The other half of the story is the pipeline. At 1 September, 3,100 of those 7,000 applications were live agreements. Defra's own blog put offers issued at around 3,600 by the end of August, with an average of 24 days from submission to offer. So there are roughly 3,300 eligible applications still being processed or awaiting acceptance, and that matters for the budget maths further down.
Submitted, eligible and live figures from Defra's statistical release (1 September). Offers issued (approx. 3,600) from Defra's Farming Blog, 29 August. The two sources use different dates and rounding, so treat the offers step as indicative.
View data table
| Stage | Applications |
|---|---|
| Submitted | 7,000 |
| Eligible | 6,900 |
| Offers issued | 3,600 |
| Live agreements | 3,100 |
The typical Window 1 agreement is a small grassland farm doing four things
Agreements contain 3.7 actions on average. One action, CLIG3 low-input grassland, appears in three-quarters of them. Divide the published areas by the agreement counts and you get a clear picture of the median farm: about 20 hectares of low-input grassland, 6.6 kilometres of hedgerow, 10 hectares under a haymaking supplement and, for the more ambitious, 17 hectares of herbal leys.
Total £9,181 a year. Defra's published average is £9,700 a year; the gap is the long tail of other actions.
View data table
| Action | Annual value |
|---|---|
| Herbal leys (CSAM3): 17 ha × £224 | £3,808 |
| Low-input grassland (CLIG3): 19.5 ha × £151 | £2,945 |
| Haymaking supplement (GRH7): 10 ha × £157 | £1,570 |
| Manage hedgerows (CHRW2): 6,600 m × £13/100m | £858 |
- Grassland
- Boundaries
- Soil & nutrients
- Water & wetlands
- Arable & IPM
- Other
We stop at 300 because the next 11 actions all round to 200 (BND1, BND2, CAHL2, CAHL3, CAHL4, CIGL1, CIPM2, CIPM3, CSAM2, PRF1, SCR2). Defra rounds to one significant figure below 1,000, so there is no meaningful ranking among them.
View data table
| Action | Category | Agreements |
|---|---|---|
| Low-input grassland (CLIG3) | Grassland | 2,300 |
| Manage hedgerows (CHRW2) | Boundaries | 1,200 |
| Haymaking supplement (GRH7) | Grassland | 800 |
| Herbal leys (CSAM3) | Soil & nutrients | 600 |
| Manage ponds (WBD1) | Water & wetlands | 500 |
| Lenient grazing supplement (GRH10) | Grassland | 400 |
| Traditional farm buildings (HEF1) | Other | 400 |
| Legumes on improved grassland (CNUM2) | Soil & nutrients | 400 |
| Haymaking supplement (late cut) (GRH8) | Grassland | 300 |
| No insecticide on arable crops (CIPM4) | Arable & IPM | 300 |
| Winter bird food on grassland (CIGL2) | Grassland | 300 |
Two things stand out lower down. HEF1 traditional buildings made the top ten with 400 agreements, a heritage action that costs nothing to deliver if you already maintain the barn. And hedgerows: 1,200 agreements put 7,920 kilometres of hedge under management, more than five times the length of Britain end to end, at £13 per 100 metres.
Grassland actions won on count. Arable actions won on area.
Window 1 mixed two very different applicants: small farms of 3 to 50 hectares, and large farms of any size that had never held an ELM agreement. The action data shows both. Plot each action by how many agreements chose it against the average area per agreement and the two groups separate cleanly. Grassland and habitat actions cluster bottom-right: thousands of agreements, 5 to 20 hectares each. Arable and precision actions sit top-left: 200 or 300 agreements, but 60 to 150 hectares each.
- Grassland
- Soil & nutrients
- Arable & IPM
- Water & wetlands
- Other
Both axes are logarithmic. PRF1 variable-rate nutrients averages 147 ha per agreement; CIPM4 no insecticide 68 ha; CIPM3 companion crop 69 ha. Hover for values.
View data table
| Action | Category | Agreements | Ha per agreement | Est. £m a year |
|---|---|---|---|---|
| CLIG3 | Grassland | 2,300 | 19.5 | 6.76 |
| GRH7 | Grassland | 800 | 10.0 | 1.26 |
| CSAM3 | Soil & nutrients | 600 | 17.0 | 2.28 |
| CNUM2 | Soil & nutrients | 400 | 28.5 | 1.16 |
| GRH10 | Grassland | 400 | 12.2 | 0.14 |
| CIGL2 | Grassland | 300 | 7.7 | 1.18 |
| CIPM4 | Arable & IPM | 300 | 67.7 | 0.91 |
| GRH8 | Grassland | 300 | 11.0 | 0.62 |
| CAHL2 | Arable & IPM | 200 | 8.0 | 1.04 |
| CAHL3 | Arable & IPM | 200 | 4.5 | 0.53 |
| CAHL4 | Arable & IPM | 200 | 4.0 | 0.41 |
| CIGL1 | Grassland | 200 | 1.5 | 0.1 |
| CIPM2 | Arable & IPM | 200 | 5.5 | 0.88 |
| CIPM3 | Arable & IPM | 200 | 68.5 | 0.75 |
| CSAM2 | Soil & nutrients | 200 | 29.5 | 0.76 |
| PRF1 | Arable & IPM | 200 | 146.5 | 0.79 |
| SCR2 | Other | 200 | 2.5 | 0.17 |
| CAHL1 | Arable & IPM | 100 | 5.0 | 0.37 |
| CNUM3 | Soil & nutrients | 100 | 21.0 | 1.12 |
| SCR1 | Other | 100 | 4.0 | 0.24 |
| SPM3 | Grassland | 100 | 15.0 | 0.22 |
| SOH3 | Soil & nutrients | 90 | 65.6 | 0.96 |
| AHW9 | Arable & IPM | 80 | 6.2 | 0.54 |
| WBD4 | Water & wetlands | 80 | 12.5 | 0.49 |
| BFS1 | Water & wetlands | 70 | 2.9 | 0.14 |
| WBD6 | Water & wetlands | 70 | 17.1 | 0.14 |
| AHW10 | Arable & IPM | 60 | 36.7 | 0.78 |
| AHW7 | Arable & IPM | 60 | 25.0 | 0.88 |
| SOH1 | Soil & nutrients | 60 | 78.3 | 0.34 |
| BFS6 | Water & wetlands | 90 | 0.8 | 0.05 |
For agents: the arable population in Window 1 was the "no ELM agreement" cohort, not the small farms. Combined arable, IPM and precision actions covered 63,000 hectares from a few hundred agreements. Window 2 opens to every farm, including the large arable businesses coming off SFI23 and Mid Tier. Expect the arable share of the pot to rise sharply.
£30m a year is contracted. £45m or more is spoken for. Know the difference.
Defra publishes areas, not pounds. Multiply each action's published area by its SFI26 rate and the 3,100 live agreements add up to about £29.8m a year. Defra's own figure, £9,700 average times 3,100 agreements, gives £30.1m. That is the contracted position at 1 September: live agreements only.
Defra's running updates measured something different. Its blog reported "around 25%" of the £60m allocated on day one, 50% by day three and 75% by 13 July, each time "based on applications received". That is pre-allocation on submission, before eligibility checks, offers or acceptance. Defra promised a further update if the budget was fully allocated; none came, and Window 1 closed on its fixed date. So the net figure after withdrawals and rejections sat somewhere between 75% and 100%. If every one of the 6,900 eligible applications converted at the average value, Window 1 would land near £67m, above the pot. In practice some will not convert, and the RPA continues to issue offers.
Put the two measures together: £30m contracted, at least £45m spoken for, and roughly 3,300 applications still moving from one column to the other. Whatever is left when the pipeline clears rolls into Window 2. Expect single-digit to low-teens millions, not half the pot.
- Grassland
- Soil & nutrients
- Arable & IPM
- Boundaries
CLIG3 alone is £6.8m, 23% of the total. Rates from the JustFarm subsidy library, which mirrors the published SFI26 rates. Areas are rounded by Defra, so treat individual figures as ±10%.
View data table
| Action | Category | Estimated £ a year |
|---|---|---|
| Low-input grassland (CLIG3) | Grassland | £6,764,800 |
| Herbal leys (CSAM3) | Soil & nutrients | £2,284,800 |
| Haymaking supplement (GRH7) | Grassland | £1,256,000 |
| Winter bird food on grassland (CIGL2) | Grassland | £1,184,500 |
| Legumes on improved grassland (CNUM2) | Soil & nutrients | £1,162,800 |
| Legume fallow (CNUM3) | Soil & nutrients | £1,117,200 |
| Winter bird food on arable (CAHL2) | Arable & IPM | £1,036,800 |
| Manage hedgerows (CHRW2) | Boundaries | £1,029,600 |
| Summer-sown cover crop (SOH3) | Soil & nutrients | £961,700 |
| No insecticide on arable crops (CIPM4) | Arable & IPM | £913,500 |
- Share of agreements
- Share of value
"Other" groups heritage, scrub, organic, agroforestry and moorland actions. Families are JustFarm groupings, not Defra's.
View data table
| Family | Share of agreements | Share of value |
|---|---|---|
| Grassland | 39.0% | 34.5% |
| Arable & IPM | 17.7% | 30.0% |
| Soil & nutrients | 12.7% | 22.2% |
| Boundaries | 14.0% | 4.5% |
| Water & wetlands | 8.4% | 4.5% |
| Other | 8.3% | 4.2% |
The Window 2 arithmetic: £240m total, minus what Window 1 finally commits, plus the extra £50m announced in August. Call it £230m to £245m, opening 22 September to every farmer and land manager, with a £100,000 per year cap per agreement and one SFI26 agreement per business. Window 1 was three-quarters spoken for within a fortnight of opening. Window 2 opens to a far larger pool, including the 25,000 SFI23 agreements starting to expire.
Three actions had no takers at all
Of the 71 actions on offer, 68 appear in the data and 12 of those have fewer than ten agreements. Nobody chose the two moorland grazing actions (UPL1, UPL2) or the extensive native-breeds supplement (SPM5), which tells you upland farms were not in Window 1's target groups: most already hold CS or SFI23 agreements. Organic conversion managed 54 agreements across five actions. Precision farming was a mixed picture: PRF1 variable-rate nutrients covered 29,300 hectares, but PRF4 robotic weeding had nine.